
Kubric — the autonomous SRE for Kubernetes
Kubric connects to your Kubernetes clusters, detects failures, pinpoints the root cause with AI, and ships fixes — with you in control. This guide takes you from sign-up to your first one-click fix.
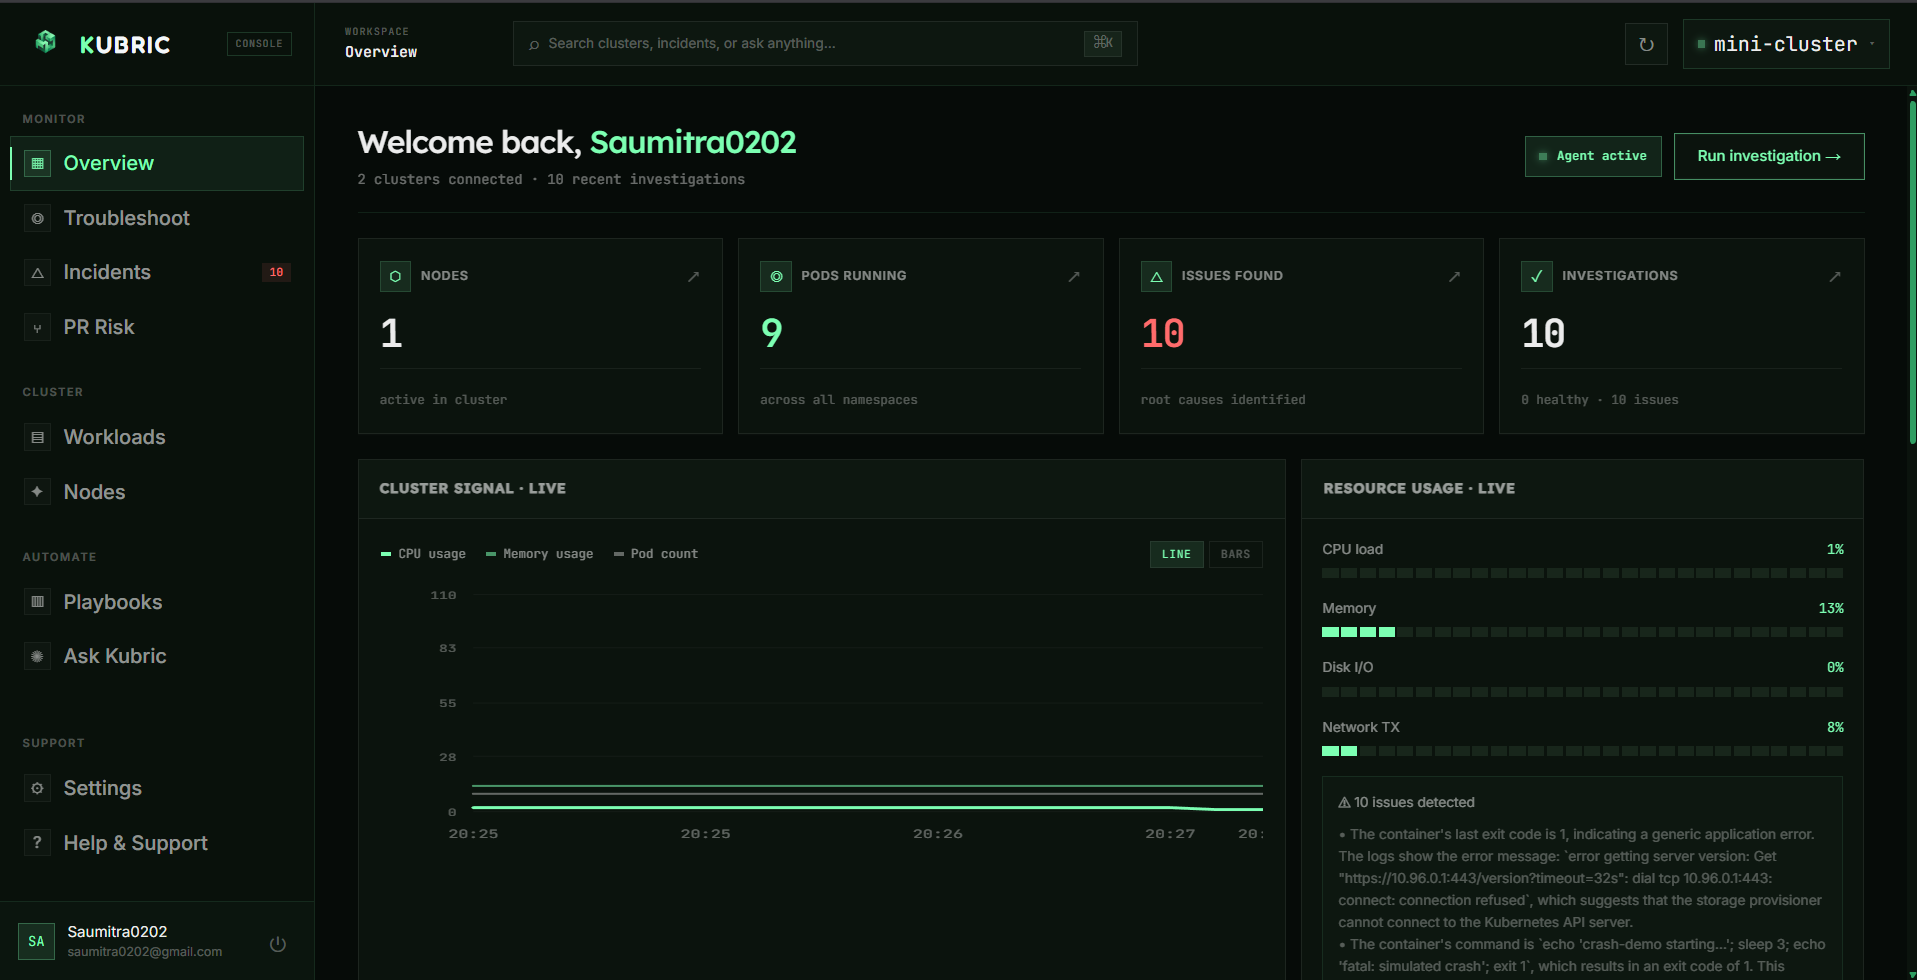
Kubric is push-based: a lightweight agent runs inside your cluster, collects state over outbound HTTPS, and Kubric reasons over it. Kubric never needs inbound access to your control plane, and no cluster credentials ever leave your environment.
Prerequisites
Before you connect a cluster, make sure you have:
- A running Kubernetes cluster. Kubric does not create the cluster for you — you bring your own (kind, minikube, EKS, GKE, AKS, or any conformant cluster). Confirm access with kubectl get nodes.
- helm 3 and kubectl installed on the machine you run the install command from.
- Outbound HTTPS from the cluster to the Kubric backend. The agent only makes outbound calls — no inbound firewall changes needed.
- metrics-server (recommended) for CPU/memory numbers. On minikube: minikube addons enable metrics-server. Without it, workloads and incidents still work; only CPU/memory show as 0.
- A Kubric account (free for clusters under 10 nodes).
The Kubric backend never connects into your cluster. The in-cluster agent pushes data outbound and runs with scoped, least-privilege RBAC.
Quick start
Create an account and name your cluster
Sign up, then the onboarding wizard asks you to name the cluster (e.g. production-eks) and generates a connection token.
Install the agent
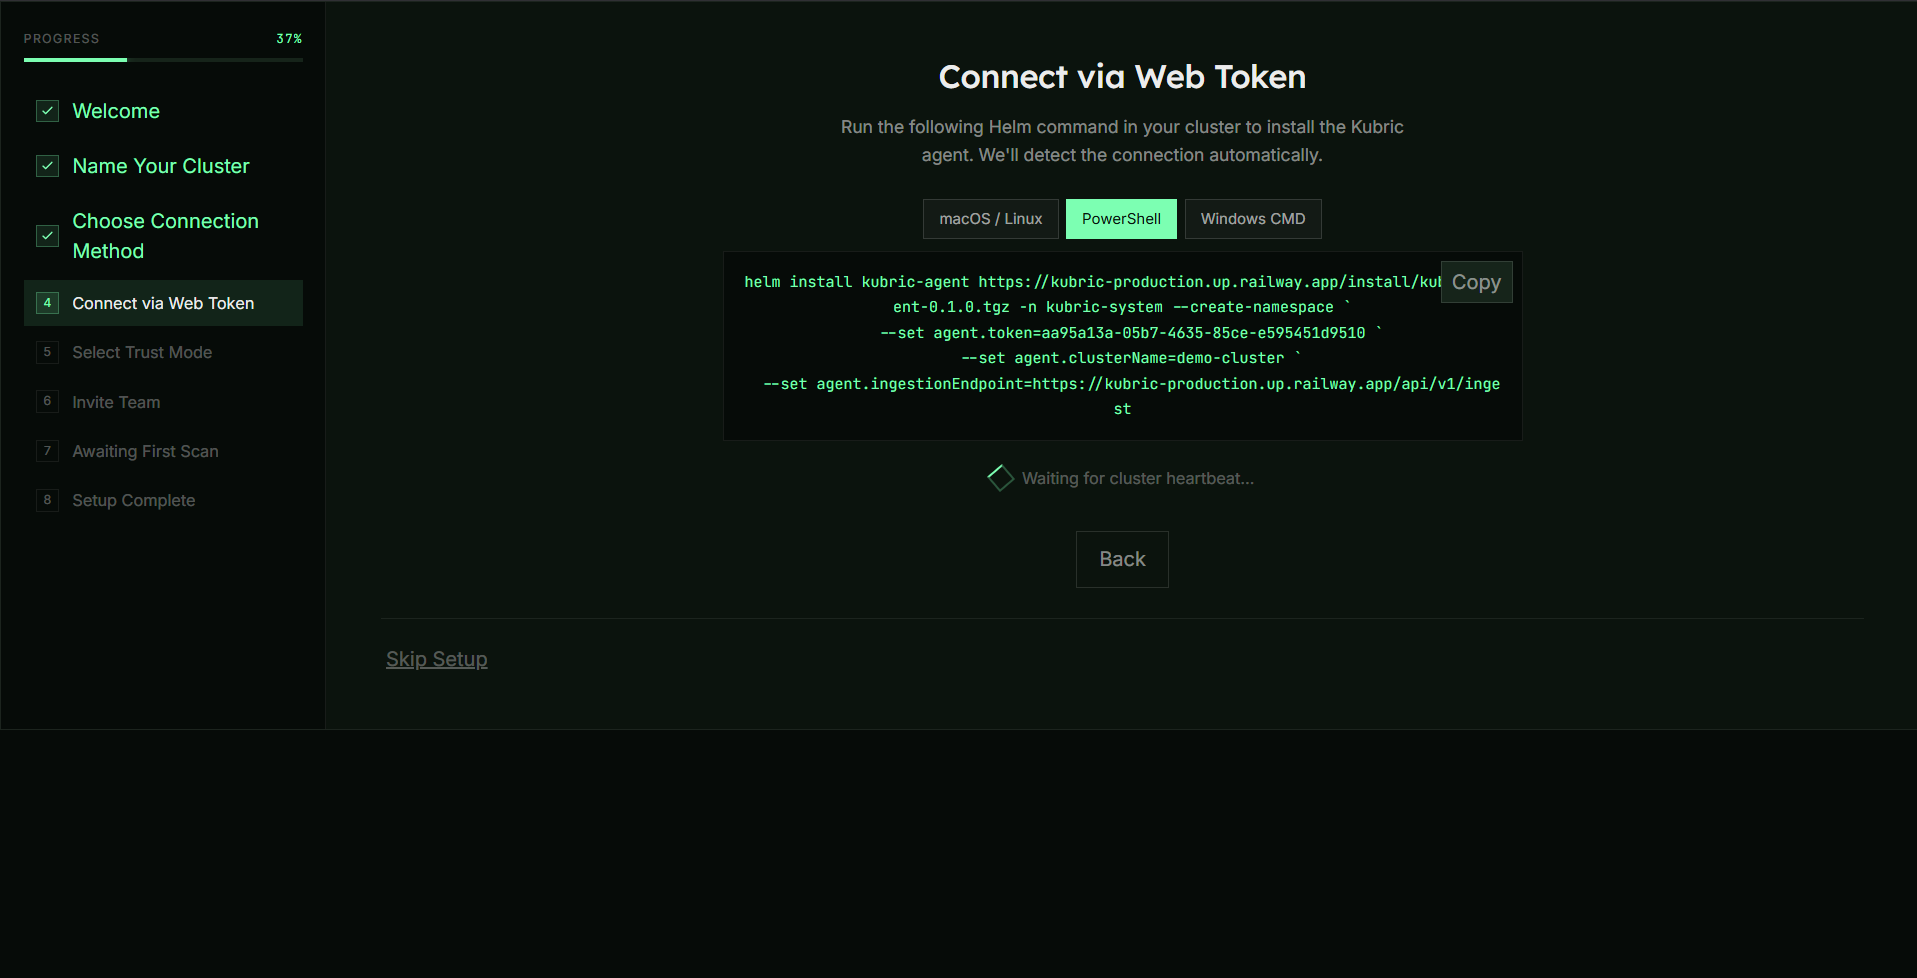
Copy the Helm command shown for your shell and run it against your cluster:
helm install kubric-agent https://<your-backend>/install/kubric-agent-0.1.0.tgz \
  -n kubric-system --create-namespace \
  --set agent.token=<your-token> \
  --set agent.clusterName=<your-cluster-name> \
  --set agent.ingestionEndpoint=https://<your-backend>/api/v1/ingest
Watch it connect
Within ~30 seconds the cluster appears in the dashboard with live data. That's it — no cluster credentials shared, no inbound access.
The chart installs directly from a URL, so anyone with helm and kubectl can install the agent — no need to clone the project.
Create your account
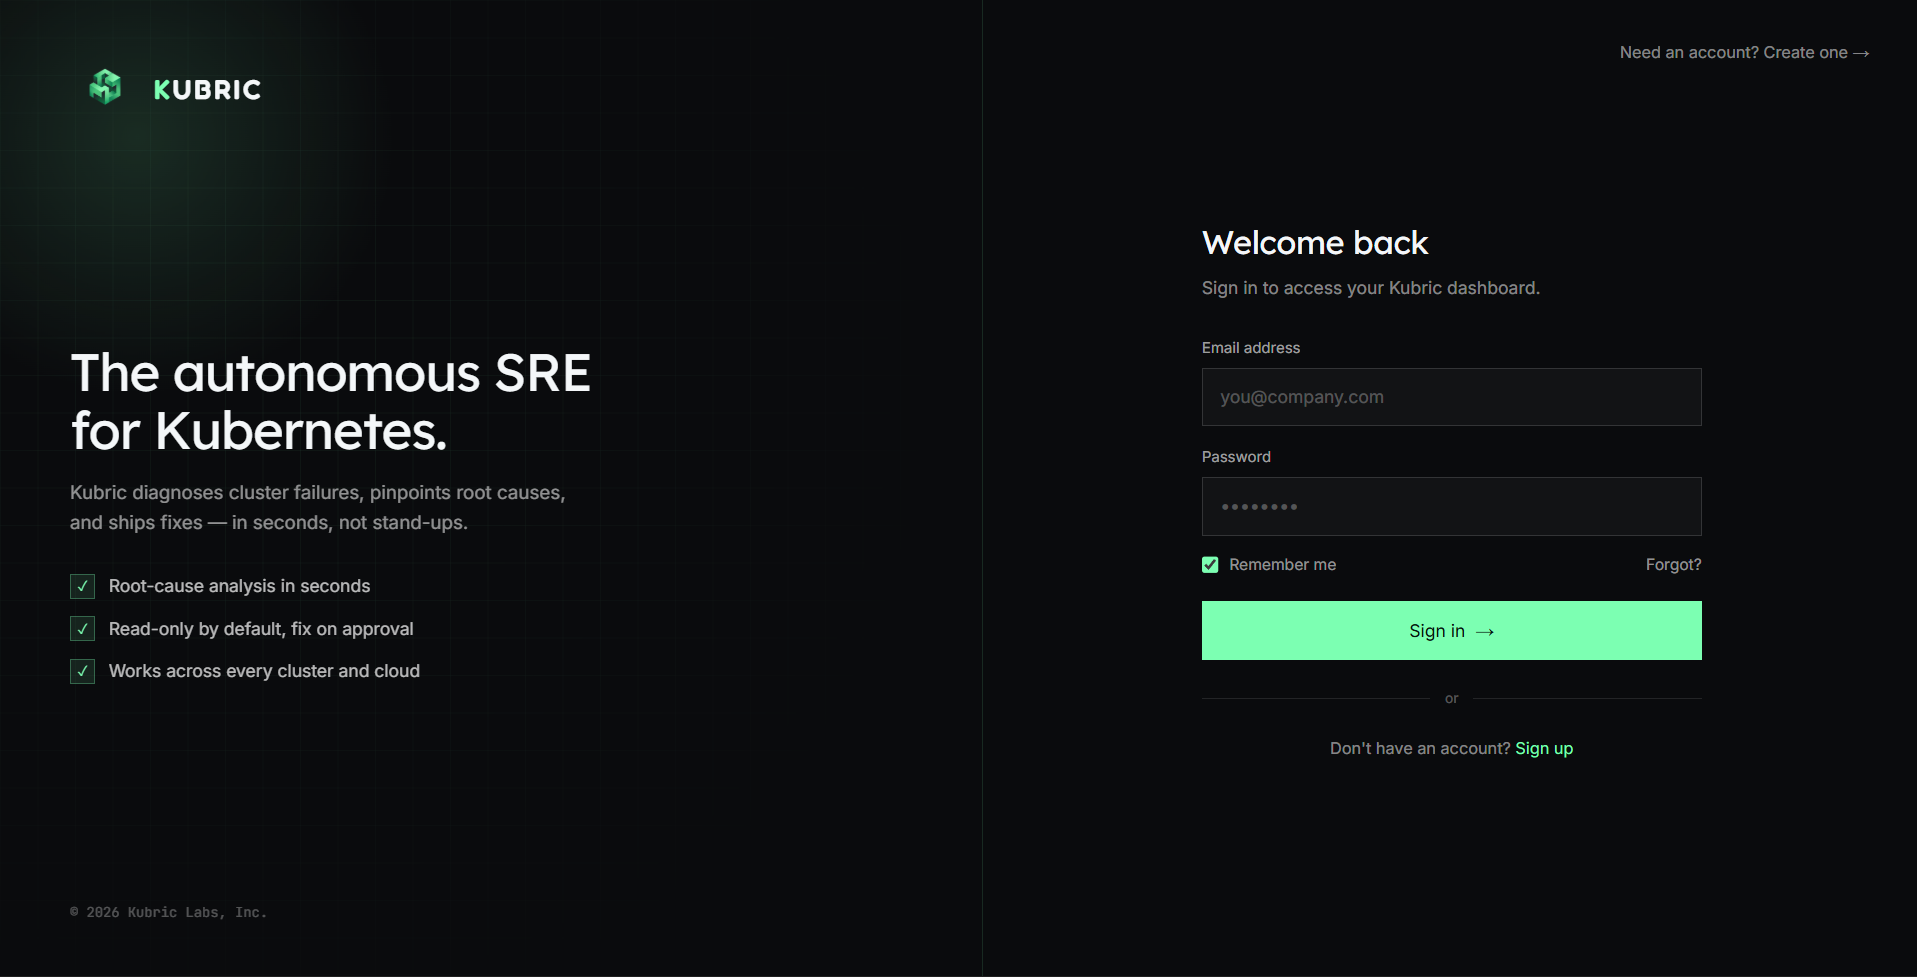
Sign up with email + password (verified by a 6-digit code) or with Google/GitHub. Forgot your password? Use the Forgot? link — we email a reset code, then you set a new password.
Onboarding wizard
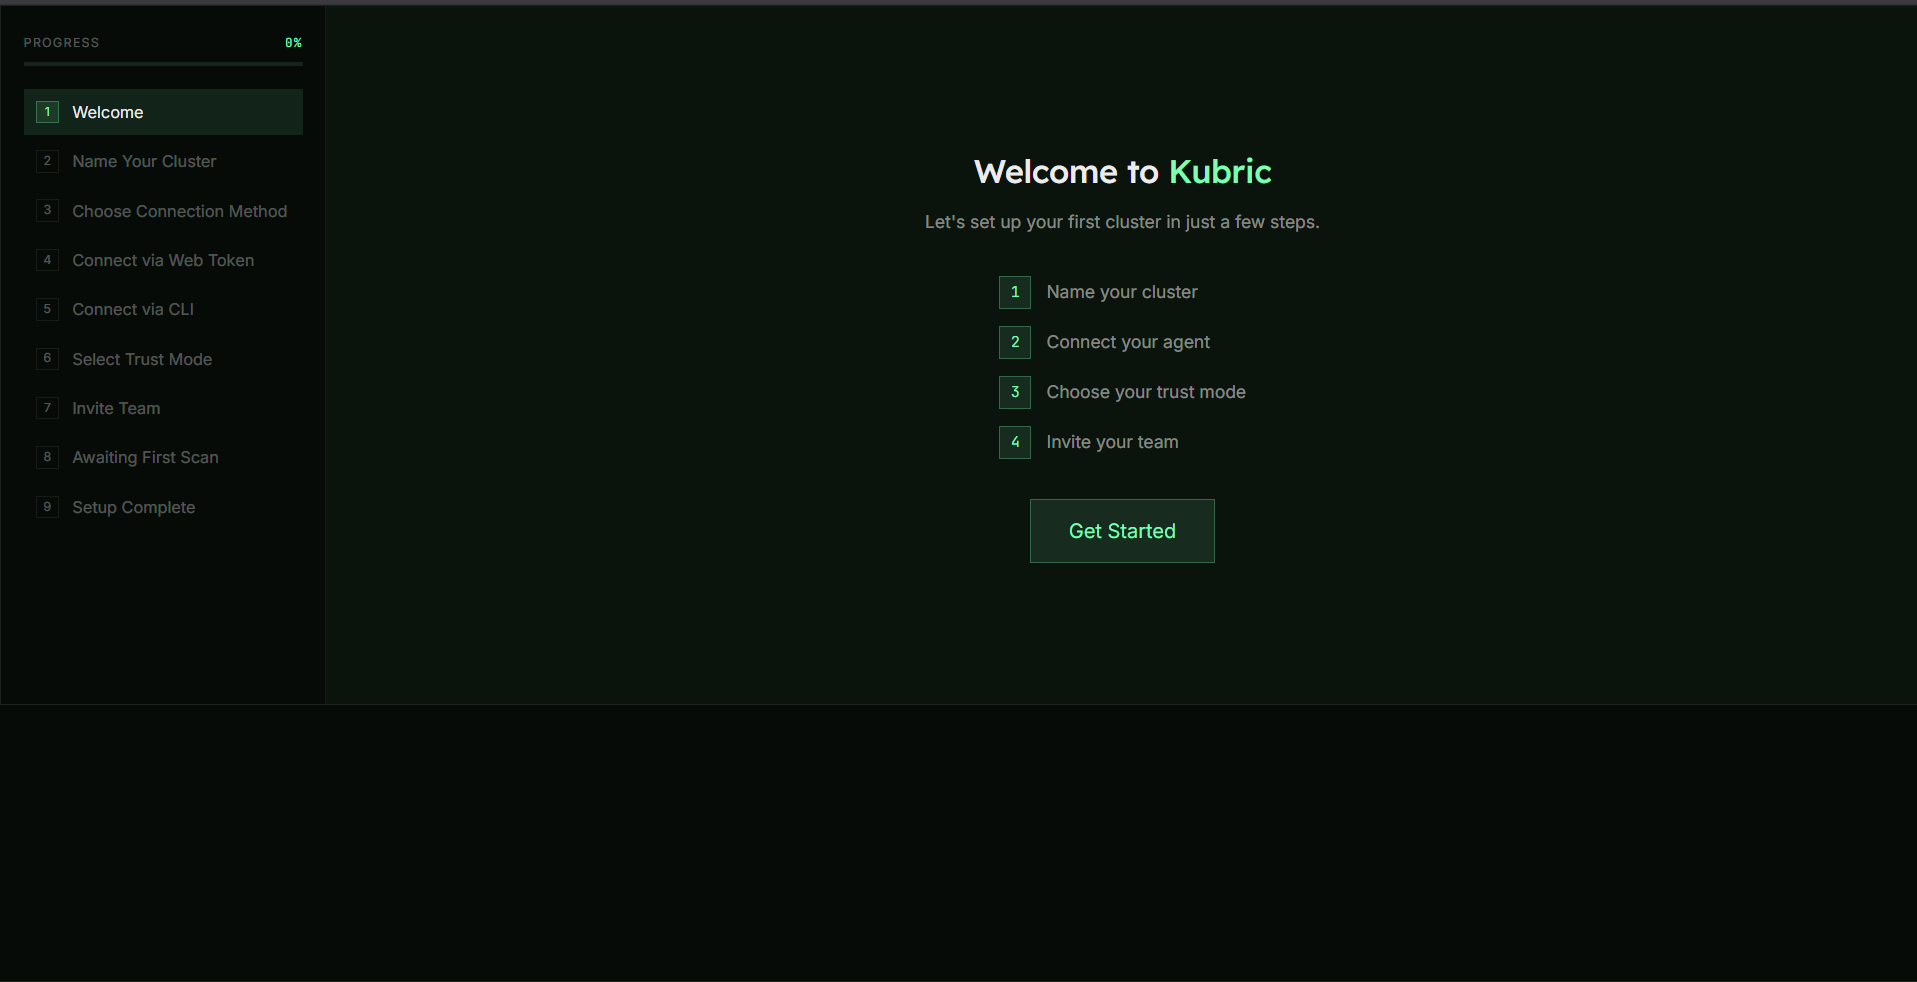
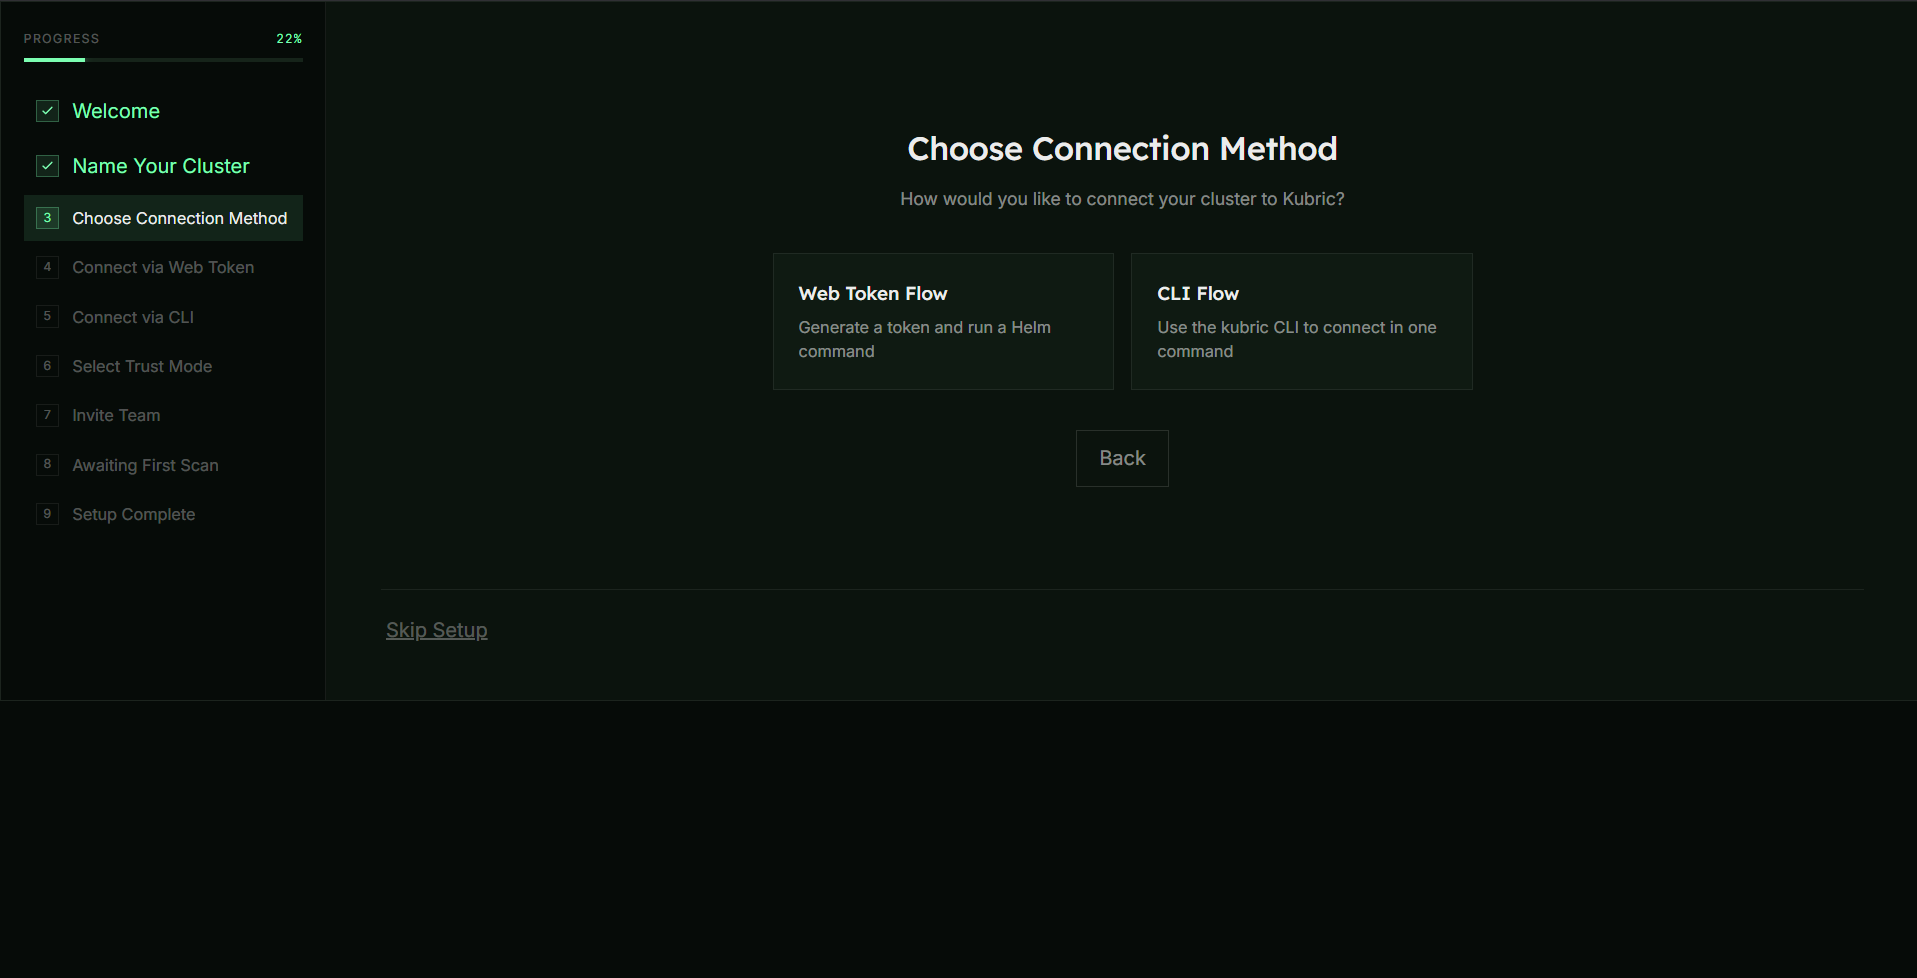
New accounts land in a guided wizard that takes you from zero to your first scan. A progress tracker on the left shows every step.
Welcome
A quick intro to what happens next.
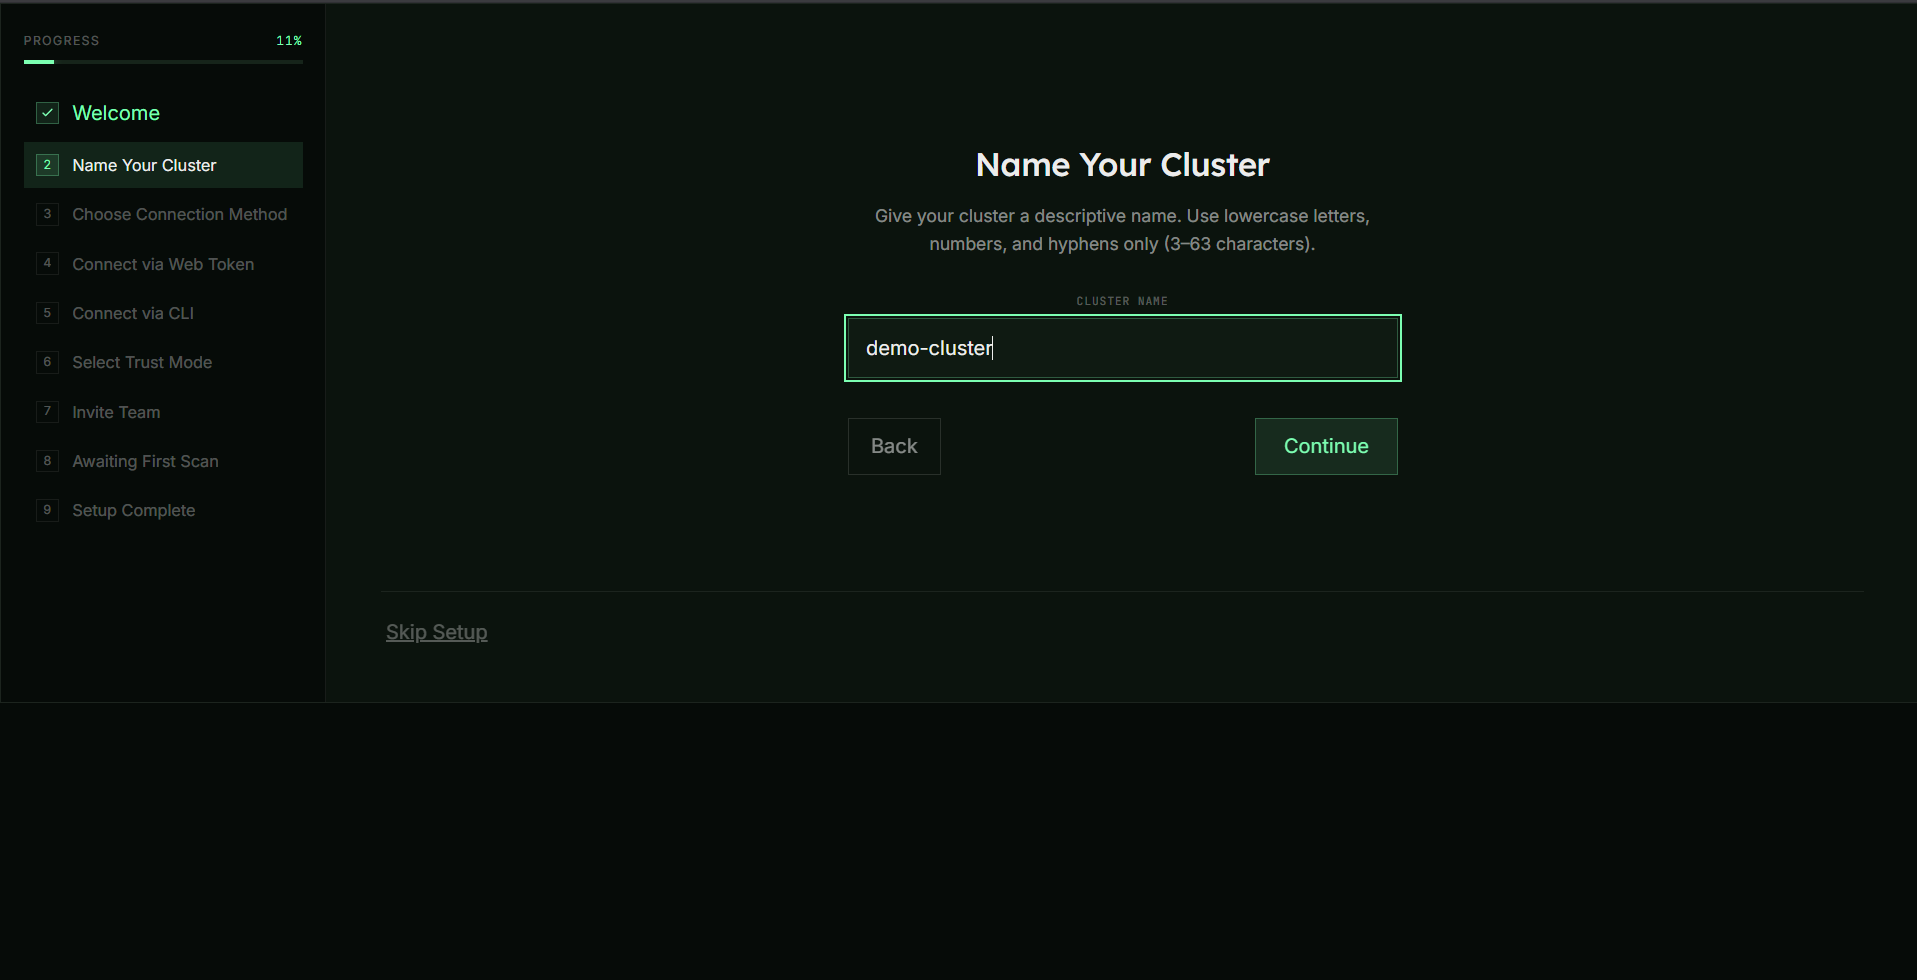
Name your cluster
Lowercase letters, numbers, and hyphens, 3–63 chars (e.g. staging-gke).
Choose a connection method
Web Token (generate a token + run Helm) or CLI (kubric login then kubric connect).
Connect the cluster
Run the install command; Kubric waits for the agent to report in.
Select a trust mode
Suggest, Approve (default), or Auto-fix — see below.
Invite your team (optional)
Add teammates by email, or skip.
Awaiting first scan → done
Once data arrives you get a summary and a “Go to dashboard” button.
Connect a cluster
On the Web Token step, Kubric generates a per-cluster token and a ready-to-run Helm command. Pick the tab that matches your terminal — the command is formatted for macOS/Linux, PowerShell, or Windows CMD so it pastes and runs cleanly.
Verify the agent is running
kubectl -n kubric-system get pods
kubectl -n kubric-system logs -l app=kubric-agent --tail=20
You want the agent pod Running and log lines like [agent] Pushed cluster state…. Within ~30s the cluster populates in the dashboard.
1) The agent image must be pullable by your cluster (public registry). 2) For CPU/memory numbers, install metrics-server. Neither blocks incident detection or fixes.
Using a managed cloud cluster (EKS / GKE / AKS)?
The agent runs on any conformant cluster — nothing is minikube-specific — but managed clusters have a few extra requirements (kubeconfig, metrics-server, node scheduling, and Fargate profiles on EKS). We've put those in their own section so nothing bites you mid-install: see Managed clusters →.
Trust modes
You decide how much autonomy Kubric has. Change it any time in Settings → Trust & Automation.
| Mode | What it does |
|---|---|
| Suggest | Kubric shows the diagnosis and recommended fix. You run it yourself. Zero automated actions. |
| Approve default | Kubric prepares the fix and waits for your one-click approval before the in-cluster agent applies it. |
| Auto-fix | Kubric remediates defined issue categories automatically, within the boundaries you set. |
Managed Kubernetes (EKS / GKE / AKS)
The Kubric agent is a single lightweight pod, so it runs on any conformant cluster with no code changes. Managed cloud clusters just add a few environment concerns that a local minikube never has. Work through this section once and the install is a single Helm command — the same one shown in the wizard.
On managed clusters, 99% of failed installs are scheduling problems, not Kubric problems — the agent image is fine, but the cluster has nowhere to place the pod. The two usual causes are EKS Fargate profiles and node pod-capacity limits, both covered below. Always start by reading the scheduler's own reason:
kubectl -n kubric-system describe pod -l app=kubric-agent
# scroll to Events: → look for the FailedScheduling message
1 · Point kubectl & helm at the right cluster
# EKS
aws eks update-kubeconfig --name <cluster-name> --region <region>

# GKE
gcloud container clusters get-credentials <cluster-name> --region <region>

# AKS
az aks get-credentials --resource-group <rg> --name <cluster-name>

# confirm you're on the intended cluster
kubectl config current-context
kubectl get nodes
Every command below acts on whatever current-context points at — double-check it before installing so you don't connect the wrong cluster.
2 · Install metrics-server (for CPU / memory)
Managed clusters don't bundle metrics-server the way minikube does. Without it, CPU/memory read 0 in the dashboard — incidents and fixes still work, but you lose the resource meters.
kubectl apply -f https://github.com/kubernetes-sigs/metrics-server/releases/latest/download/components.yaml
kubectl top nodes   # should return numbers within a minute
EKS/GKE/AKS kubelet certificates are valid, so you normally do not need the --kubelet-insecure-tls flag that local clusters sometimes require.
3 · Match the image to your node architecture
The default agent image is linux/amd64, which is correct for standard x86 node groups. On AWS Graviton / arm64 nodes, either use an arm64 (or multi-arch) image, or schedule the agent onto an x86 node. An architecture mismatch shows up as exec format error in the pod logs.
4 · Confirm outbound egress
The agent only makes outbound HTTPS calls, so no inbound firewall changes are needed — but the nodes must be able to reach the Kubric backend. That means a NAT gateway (for private subnets) or public subnets. Fully air-gapped clusters with no egress can't push data.
5 · Install the agent
Same cluster-agnostic command as the wizard / Settings:
helm install kubric-agent https://<your-backend>/install/kubric-agent-0.1.0.tgz \
  -n kubric-system --create-namespace \
  --set agent.token=<token> \
  --set agent.clusterName=production-eks \
  --set agent.ingestionEndpoint=https://<your-backend>/api/v1/ingest
For production you can push the agent image to your own registry and set --set agent.image.repository=<your-repo>. If the repo is private, add an image pull secret to the kubric-system namespace so the pod can pull it.
Full EKS walkthrough — every command, in order
Copy-paste this top to bottom on your local machine. Replace the <placeholders>. Commands are grouped; the comments explain what each one is for.
# ── 0. Confirm your local tools are installed ─────────────────────────
aws --version           # AWS CLI v2
kubectl version --client
helm version

# ── 1. Authenticate to AWS (skip if already configured) ───────────────
aws configure            # enter Access Key, Secret, default region
aws sts get-caller-identity   # confirm you're the right IAM identity

# ── 2. Point kubectl at your EKS cluster ──────────────────────────────
aws eks list-clusters --region <region>            # find the name
aws eks update-kubeconfig --name <cluster-name> --region <region>
kubectl config current-context                     # sanity check
kubectl get nodes -o wide                          # nodes should be Ready

# ── 3. Detect Fargate BEFORE installing ───────────────────────────────
#   If any node name starts with "fargate-ip-", it's a Fargate cluster
#   → do section "EKS Fargate clusters" first, then come back to step 5.
kubectl get nodes -o wide

# ── 4. Install metrics-server (for CPU / memory in the dashboard) ─────
kubectl apply -f https://github.com/kubernetes-sigs/metrics-server/releases/latest/download/components.yaml
kubectl -n kube-system rollout status deployment metrics-server
kubectl top nodes        # should return numbers within ~1 min

# ── 5. Install the Kubric agent ───────────────────────────────────────
helm install kubric-agent https://<your-backend>/install/kubric-agent-0.1.0.tgz \
  -n kubric-system --create-namespace \
  --set agent.token=<token> \
  --set agent.clusterName=production-eks \
  --set agent.ingestionEndpoint=https://<your-backend>/api/v1/ingest

# ── 6. Watch it come up ───────────────────────────────────────────────
kubectl -n kubric-system get pods -w      # wait for Running (Ctrl+C to stop)
kubectl -n kubric-system logs -l app=kubric-agent --tail=30
#   You want log lines like: [agent] Pushed cluster state ... 200

# ── 7. Confirm in the dashboard ───────────────────────────────────────
#   The cluster appears within ~30s. Done.
If kubectl get nodes shows names starting with fargate-ip-, complete EKS Fargate clusters → first, then come back to step 5. Otherwise carry straight on.
Don't guess — read the scheduler's reason, then jump to the matching row in the pre-flight checklist:
kubectl -n kubric-system describe pod -l app=kubric-agent
# scroll to Events: → the FailedScheduling line names the exact cause
Useful day-2 commands
# Restart the agent (e.g. after adding a Fargate profile)
kubectl -n kubric-system rollout restart deployment kubric-agent

# Update to a newer chart / change a value
helm upgrade kubric-agent https://<your-backend>/install/kubric-agent-0.1.0.tgz \
  -n kubric-system --reuse-values

# See what Helm has installed
helm -n kubric-system list

# Fully remove the agent
helm uninstall kubric-agent -n kubric-system
kubectl delete namespace kubric-system
helm upgrade --reuse-values keeps your old values but ignores new chart defaults. If an upgrade adds a new default you need, pass it explicitly with --set, or drop --reuse-values and re-supply your --set flags.
GKE / AKS: only step 2 changes — use gcloud container clusters get-credentials <name> --region <region> or az aks get-credentials --resource-group <rg> --name <name>. Steps 0 and 3–7 are identical, and neither GKE nor AKS has the Fargate step.
EKS Fargate clusters (important)
If your EKS cluster runs on Fargate— including "Fargate-only" clusters with no EC2 managed node group — the agent will sit in Pendingforever unless you do one extra step. This is the single most common reason a managed install "doesn't work", so it gets its own section.
Why it happens
On Fargate, AWS provisions a right-sized micro-VM (a "node") per pod, and it only does so for pods that match a Fargate profile (matched by namespace, and optionally labels). The Kubric agent installs into the kubric-systemnamespace. If no Fargate profile selects that namespace, AWS never creates a node for the pod, and it stays unschedulable. You'll see this in the events:
# Every node is fargate-ip-... with Capacity: pods: 1, and:
Warning  FailedScheduling  ...  0/N nodes are available: N Too many pods.
Two tells confirm it's Fargate: node names start with fargate-ip-, and each node reports Capacity: pods: 1 (a Fargate node hosts exactly one pod).
The fix — create a Fargate profile for the namespace
Reuse the pod-execution role and subnets from a profile you already have:
# 1. See existing profiles
aws eks list-fargate-profiles --cluster-name <cluster-name>

# 2. Grab the podExecutionRoleArn + subnets from one of them
aws eks describe-fargate-profile --cluster-name <cluster-name> \
  --fargate-profile-name <existing-profile-name>

# 3. Create a profile that selects the kubric-system namespace
aws eks create-fargate-profile \
  --cluster-name <cluster-name> \
  --fargate-profile-name kubric-system \
  --pod-execution-role-arn <podExecutionRoleArn-from-step-2> \
  --subnets <subnet-1> <subnet-2> \
  --selectors namespace=kubric-system
Prefer the console? EKS → your cluster → Compute → Fargate profiles → Add Fargate profile. Name it kubric-system, pick the existing pod-execution role and private subnets, and add a selector with Namespace = kubric-system (leave labels blank).
Profile creation takes ~1–2 minutes. Once it's ACTIVE, restart the deployment so the pod re-schedules onto a freshly provisioned Fargate node:
kubectl -n kubric-system rollout restart deployment kubric-agent
kubectl -n kubric-system get pods -w   # Pending → Running in ~60–90s
Cleanest sequence: create the kubric-system Fargate profile first, then run helm install. If you already installed and it's Pending, just add the profile and rollout restart — no reinstall needed.
Fargate rounds every pod up to a minimum of 0.25 vCPU / 0.5 GB, so the agent's tiny requests still bill at that floor. Expect a ~60–90s cold start per Fargate pod versus seconds on EC2. Neither affects functionality.
Managed cluster pre-flight checklist
Run through this before helm install and the agent should come up Running on the first try:
| Check | Command / action |
|---|---|
| Right cluster selected | kubectl config current-context |
| Nodes are Ready | kubectl get nodes |
| Is it Fargate? | Node names start with fargate-ip- → create a kubric-system Fargate profile first |
| Room to schedule (EC2 nodes) | kubectl describe nodes → a node with free pod capacity; if all show "Too many pods", add a node |
| metrics-server installed | kubectl top nodes returns numbers |
| Node architecture | amd64 image on x86 nodes; arm64/multi-arch on Graviton |
| Outbound HTTPS egress | NAT gateway or public subnets can reach the backend |
Still Pending? Read the scheduler, don't guess
The events section names the exact cause. Common ones on managed clusters:
| Message | Cause & fix |
|---|---|
| Too many pods (nodes are fargate-ip-) | Fargate-only cluster, no profile for the namespace → create a kubric-system Fargate profile. |
| Too many pods (EC2 nodes, all full) | Every node hit its max-pods-per-node cap → add a node to the group, or free a slot. |
| Insufficient cpu / memory | Nodes are out of allocatable resources → scale the node group up. |
| had untolerated taint | Nodes are tainted → the chart tolerates any taint by default; ensure you're on the current chart, or add a matching toleration. |
| didn't match node affinity/selector | A nodeSelector/affinity mismatch → clear or correct the selector. |
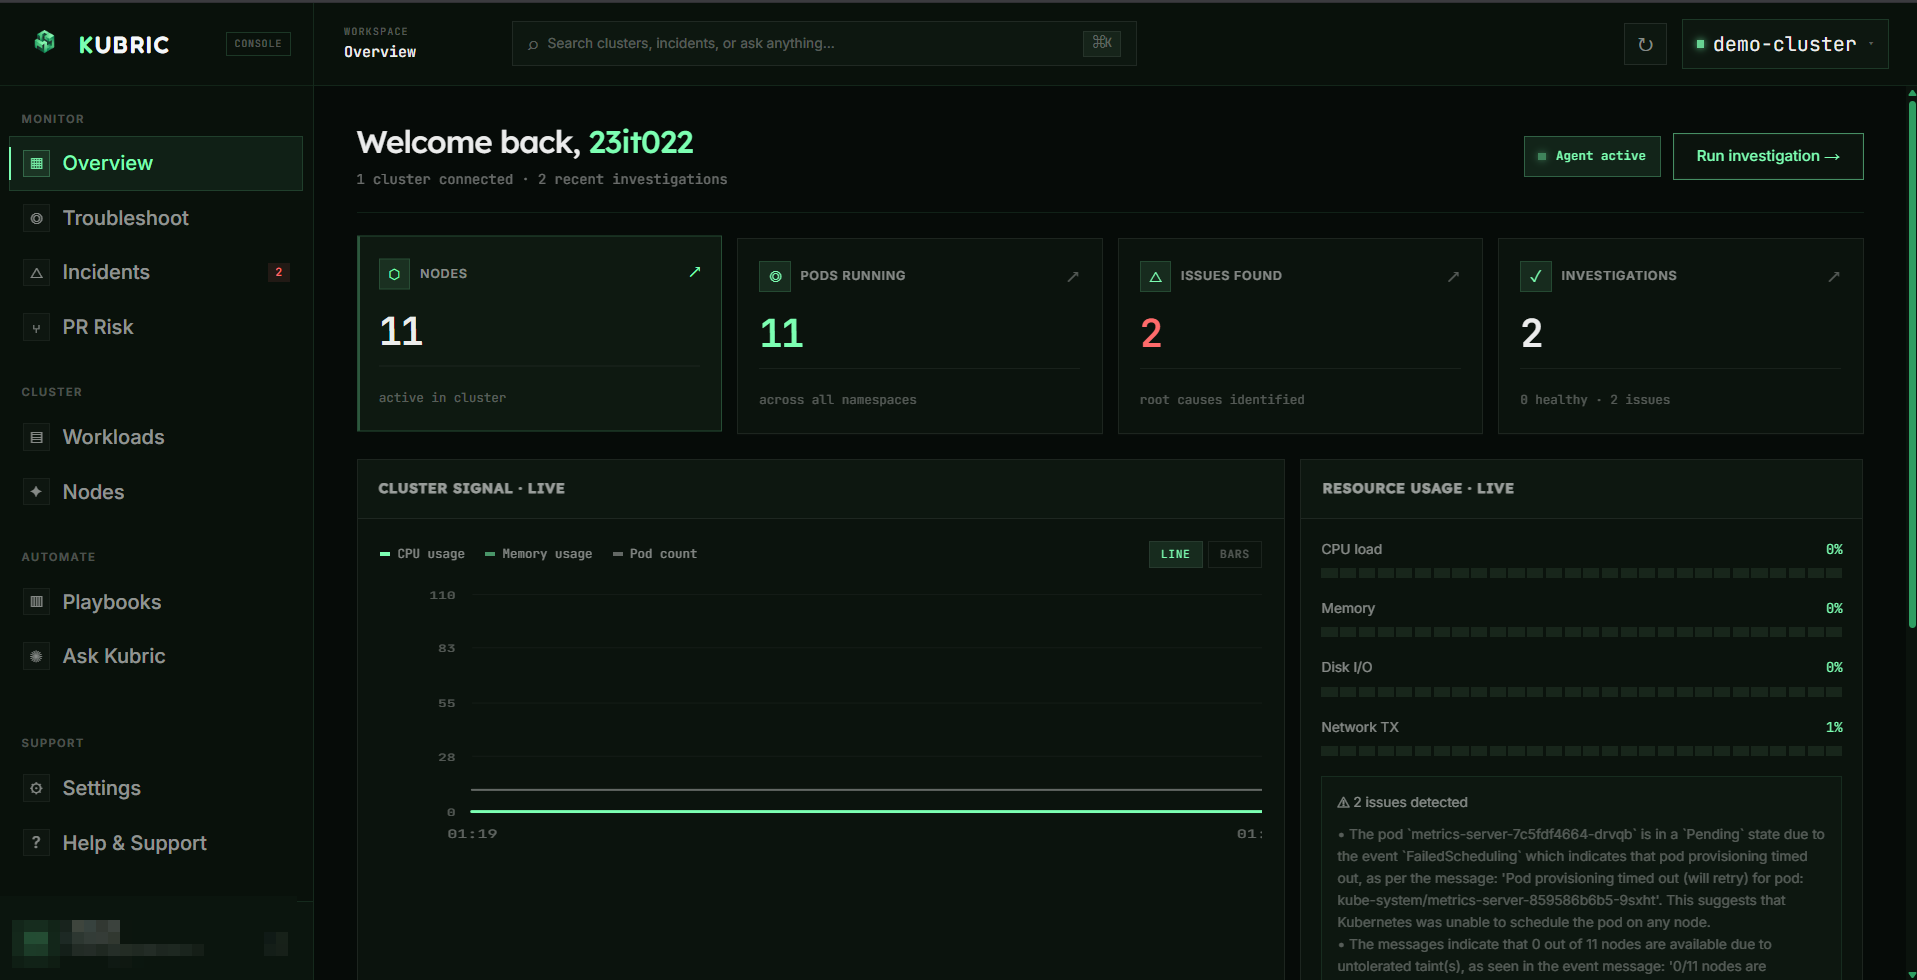
Dashboard · Overview
Your cluster at a glance: node and pod counts, issues found, and recent investigations, plus a live cluster-signal chart and resource-usage meters.
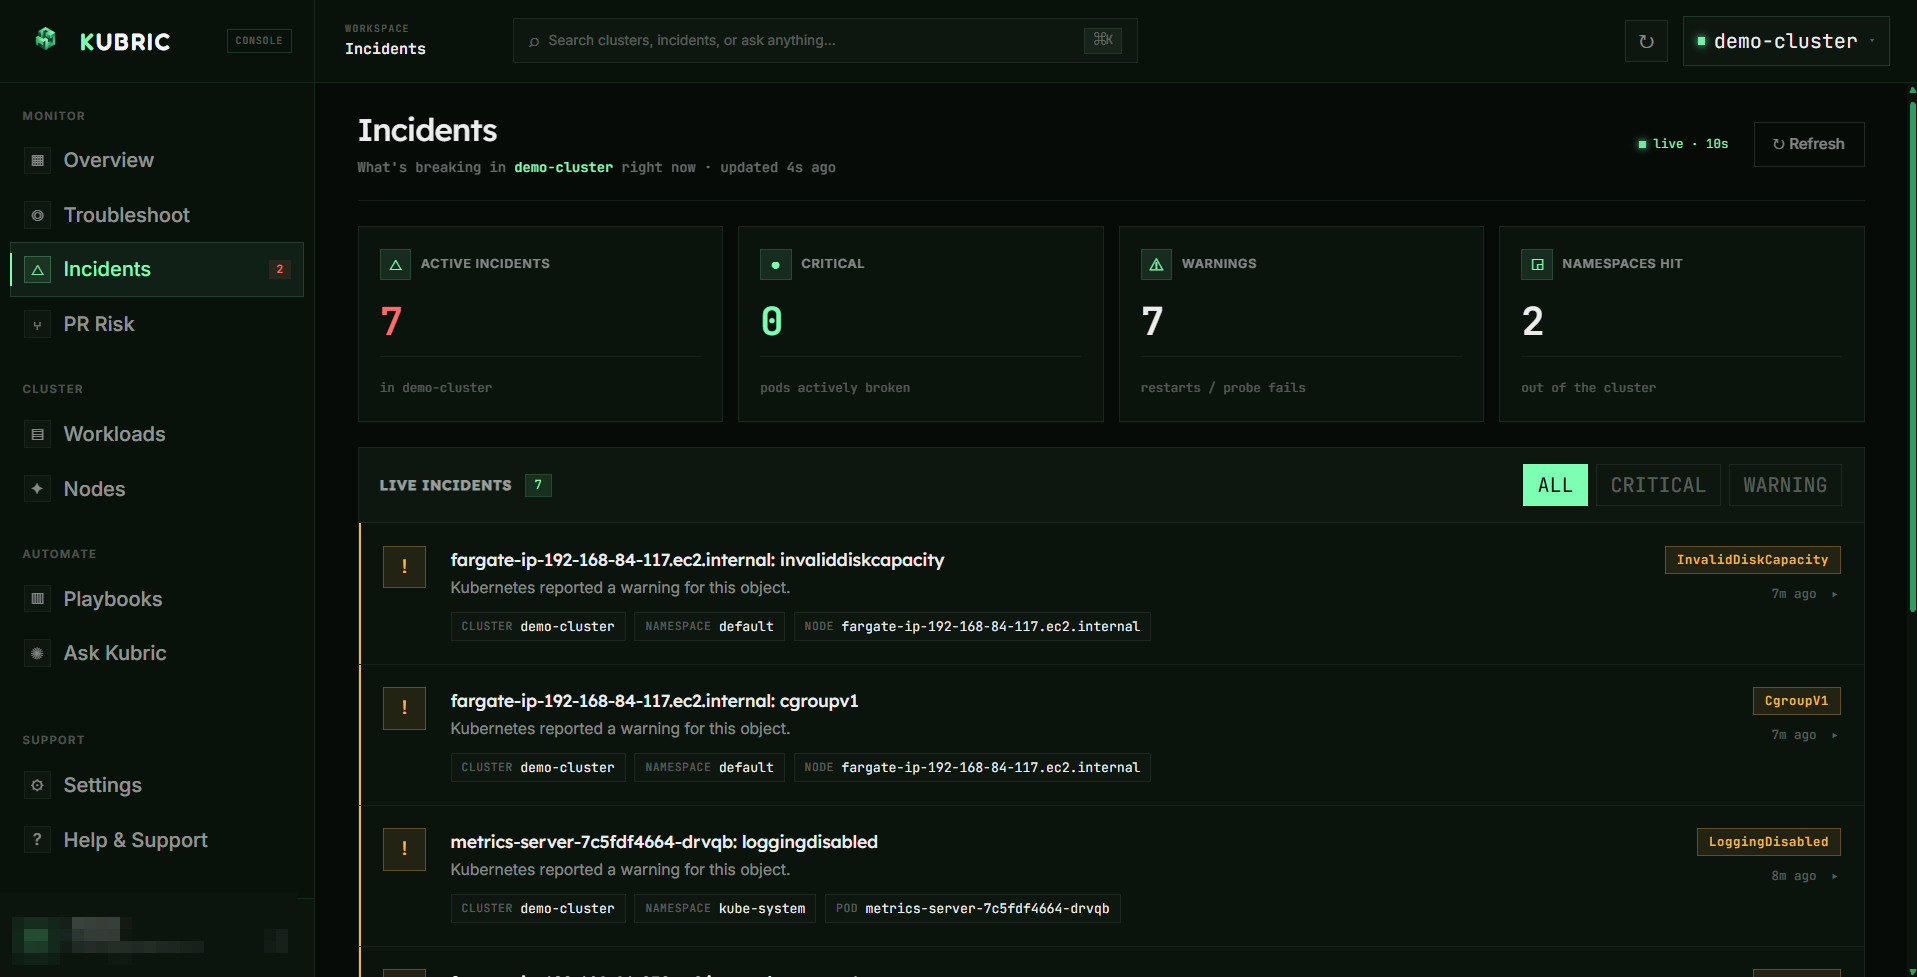
Dashboard · Incidents
Everything currently breaking in the cluster, ranked by severity. Kubric detects CrashLoopBackOff, OOMKilled, ImagePullBackOff, repeated restarts, and more — each with a plain-English “why”, the affected resource, and the failure type.
Dashboard · Troubleshoot
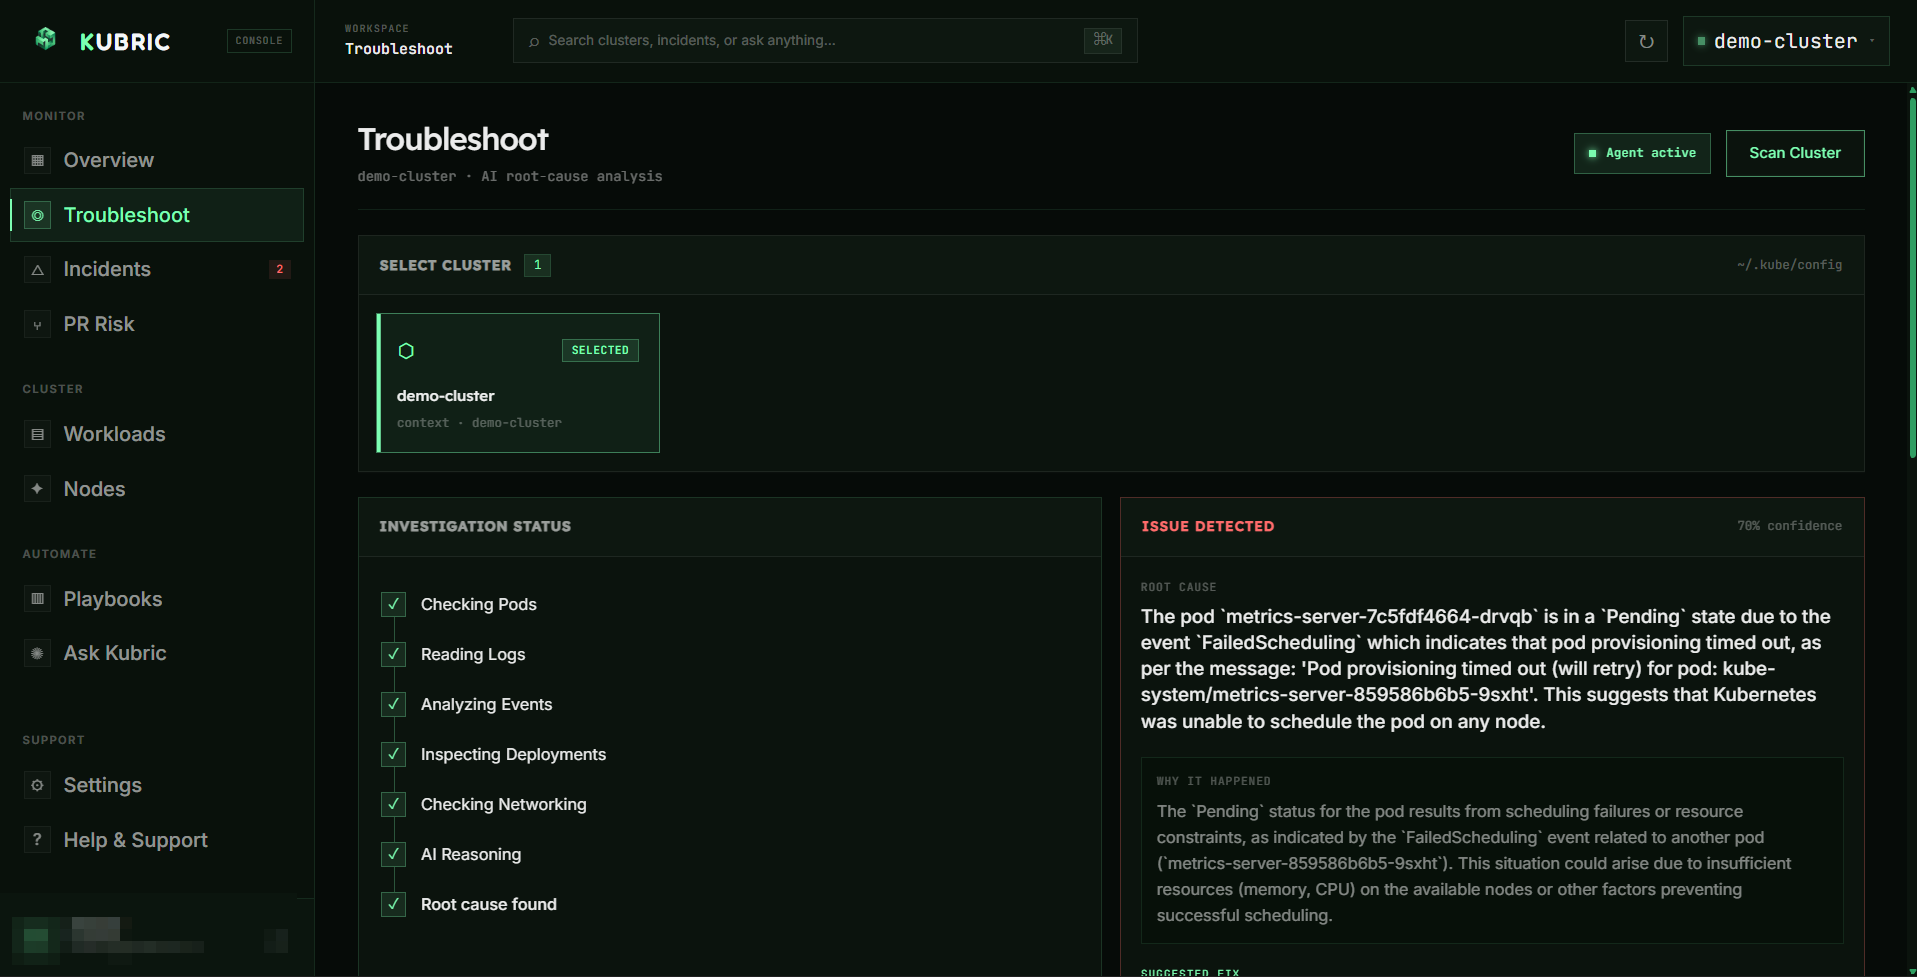
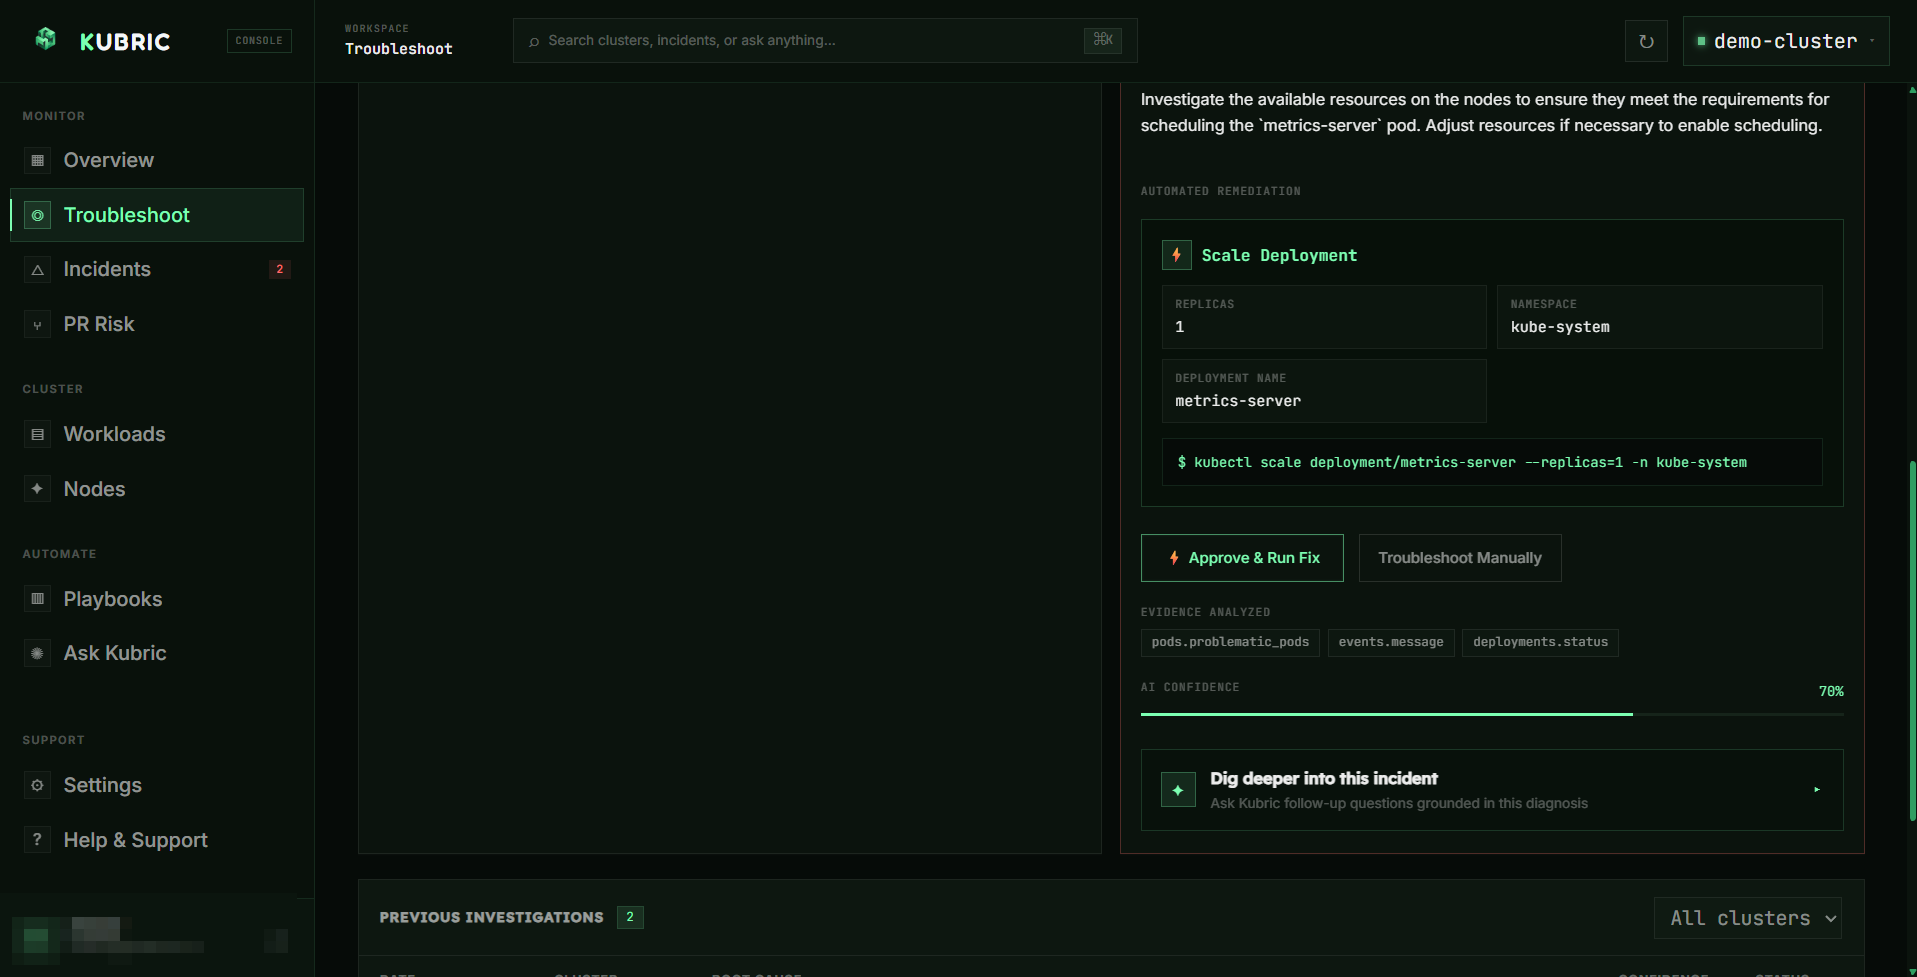
Select a cluster and click Scan Cluster. Kubric’s agent investigates step by step — checking pods, reading logs, analyzing events, inspecting deployments and networking — then the AI reasons over the evidence to produce a root cause.
Approve & Run Fix
When the fix is safe and deterministic, Kubric offers a one-click Approve & Run Fix. In Approve mode, nothing touches your cluster until you click — then the in-cluster agent applies the fix with its own RBAC and reports the result back.
Dashboard · Workloads
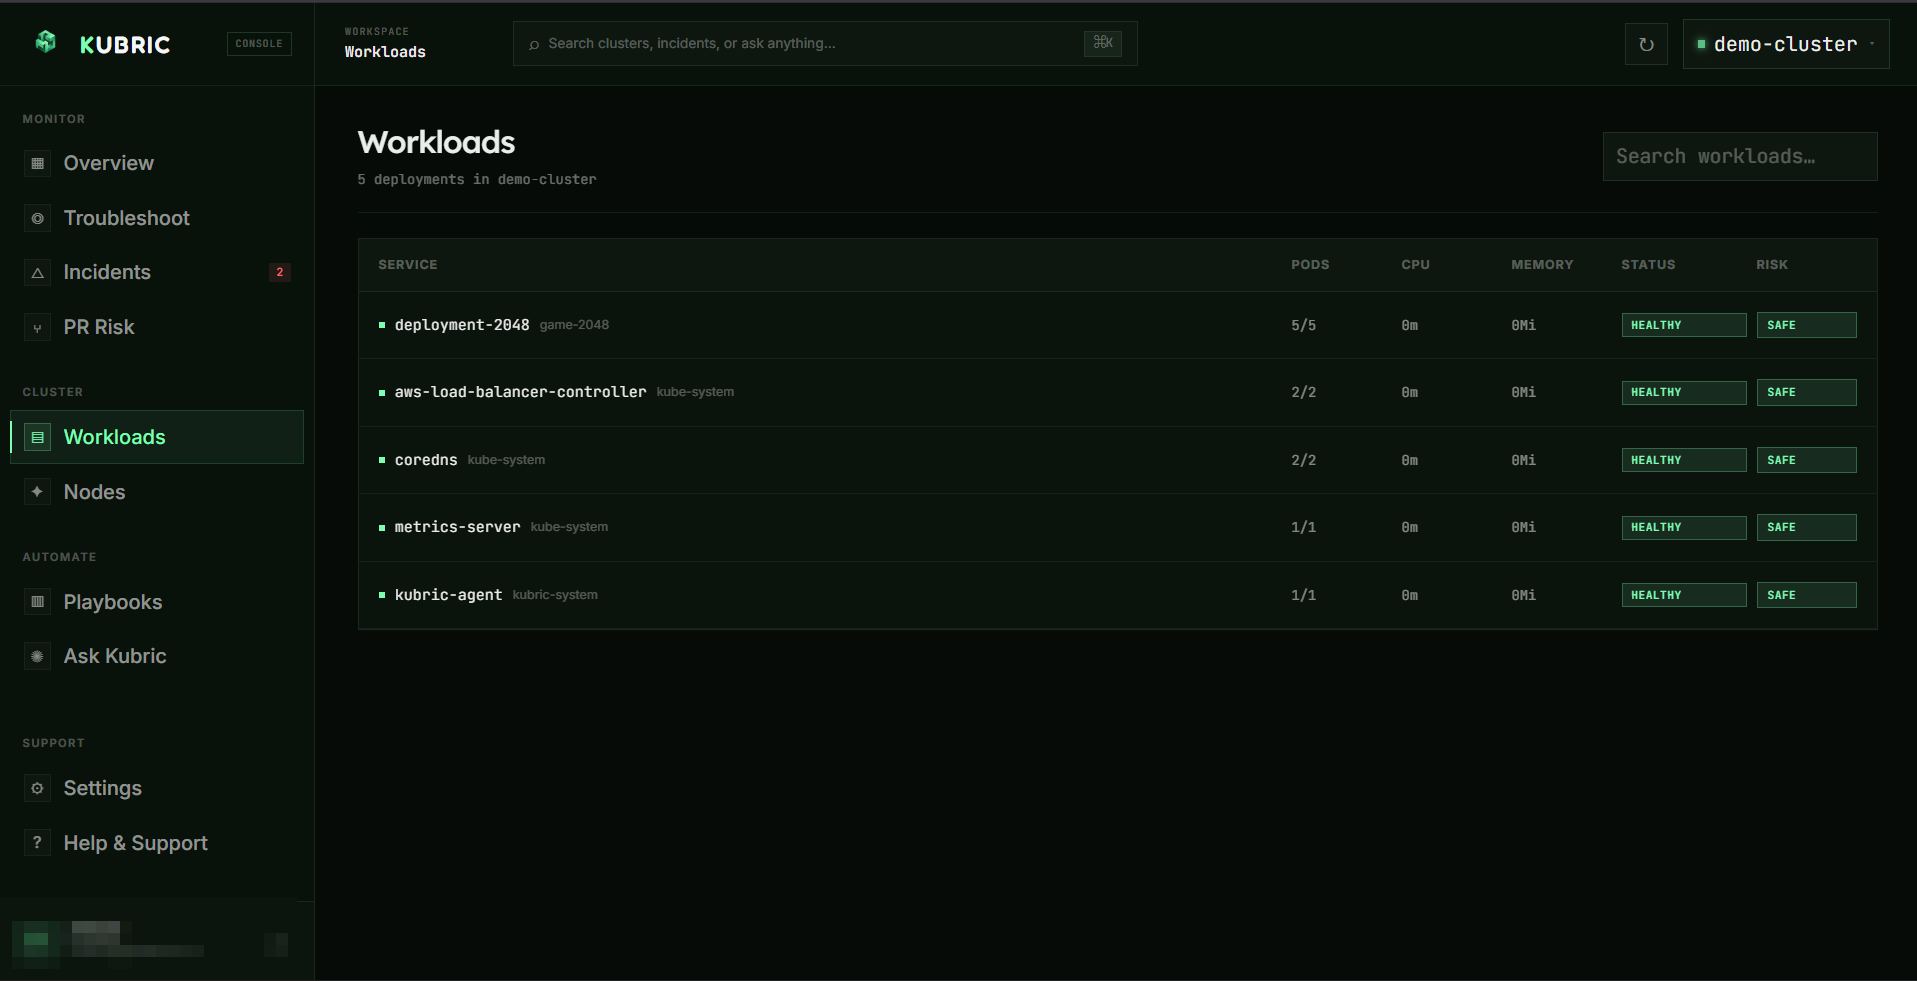
Live deployment health across every namespace — ready/desired pods, restart counts, and a status badge (Healthy / Degraded / Down).
Nodes
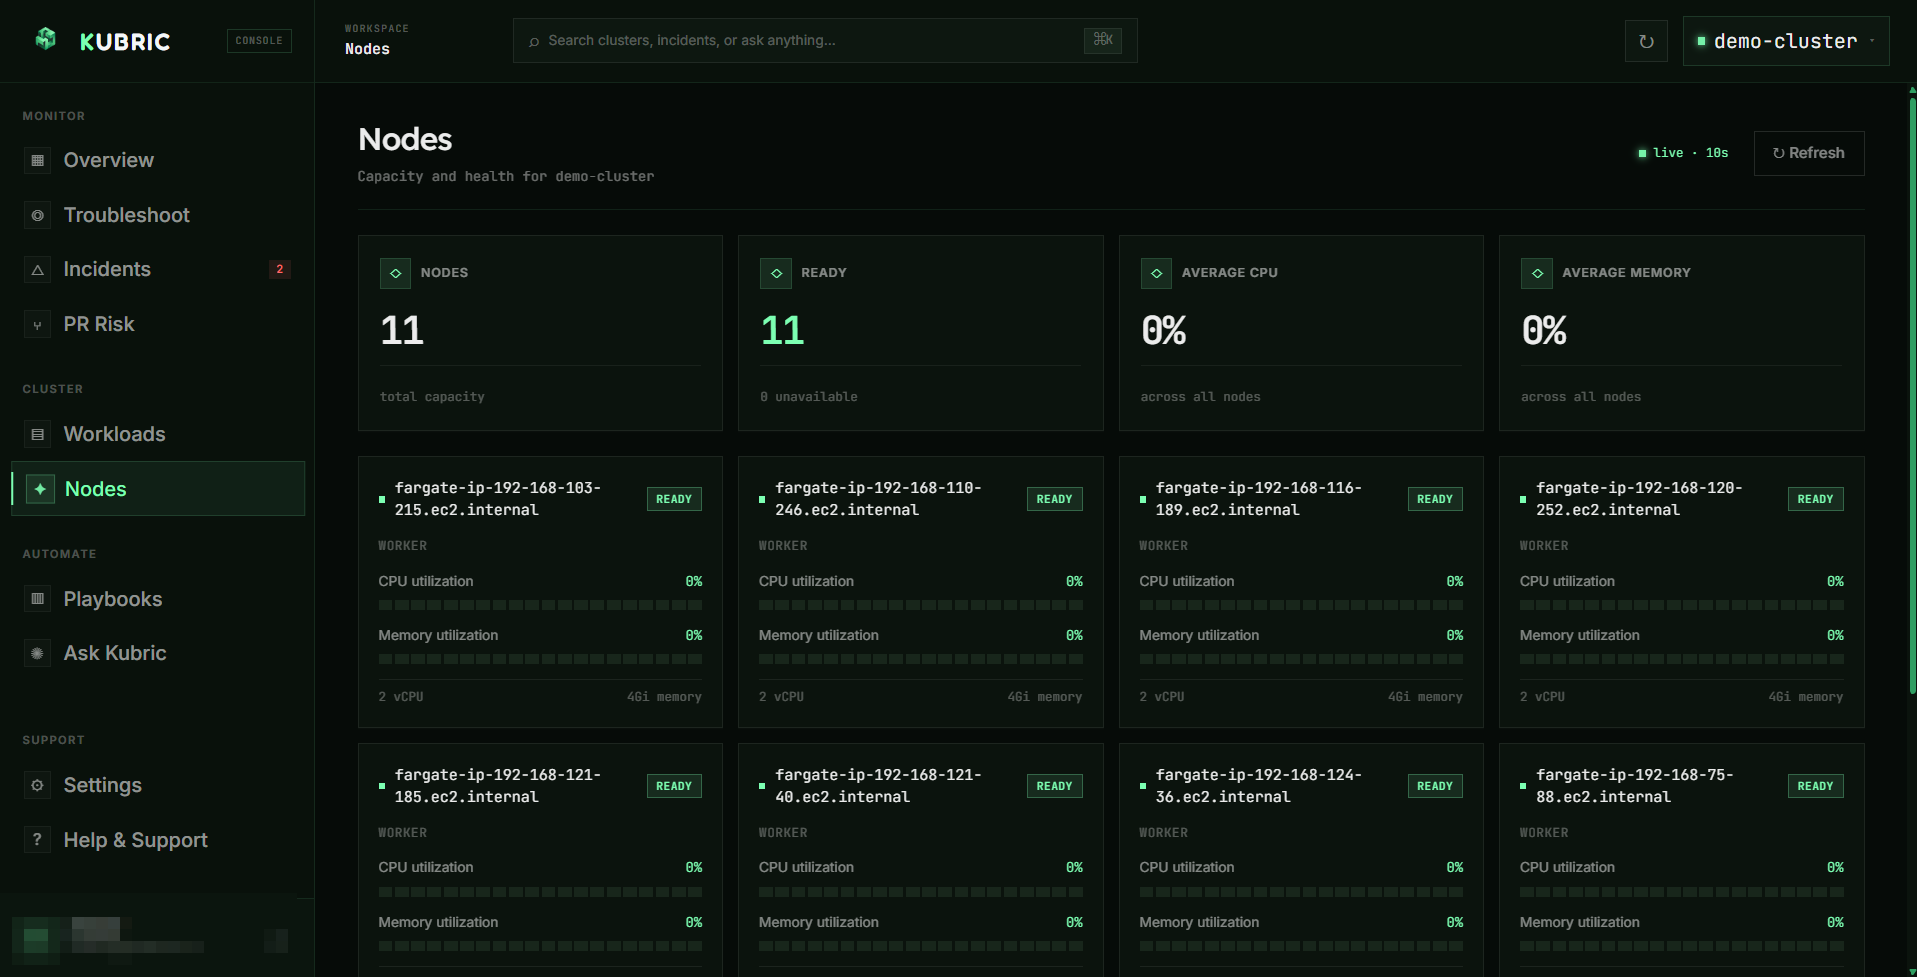
The Nodes screen shows node readiness, roles, and CPU/memory capacity and usage — useful for spotting pressure and unschedulable pods.
Dashboard · Settings
Manage connected clusters, add new ones (generate a token + copy the Helm command for your shell), set your trust mode and auto-fix boundaries, and invite teammates.
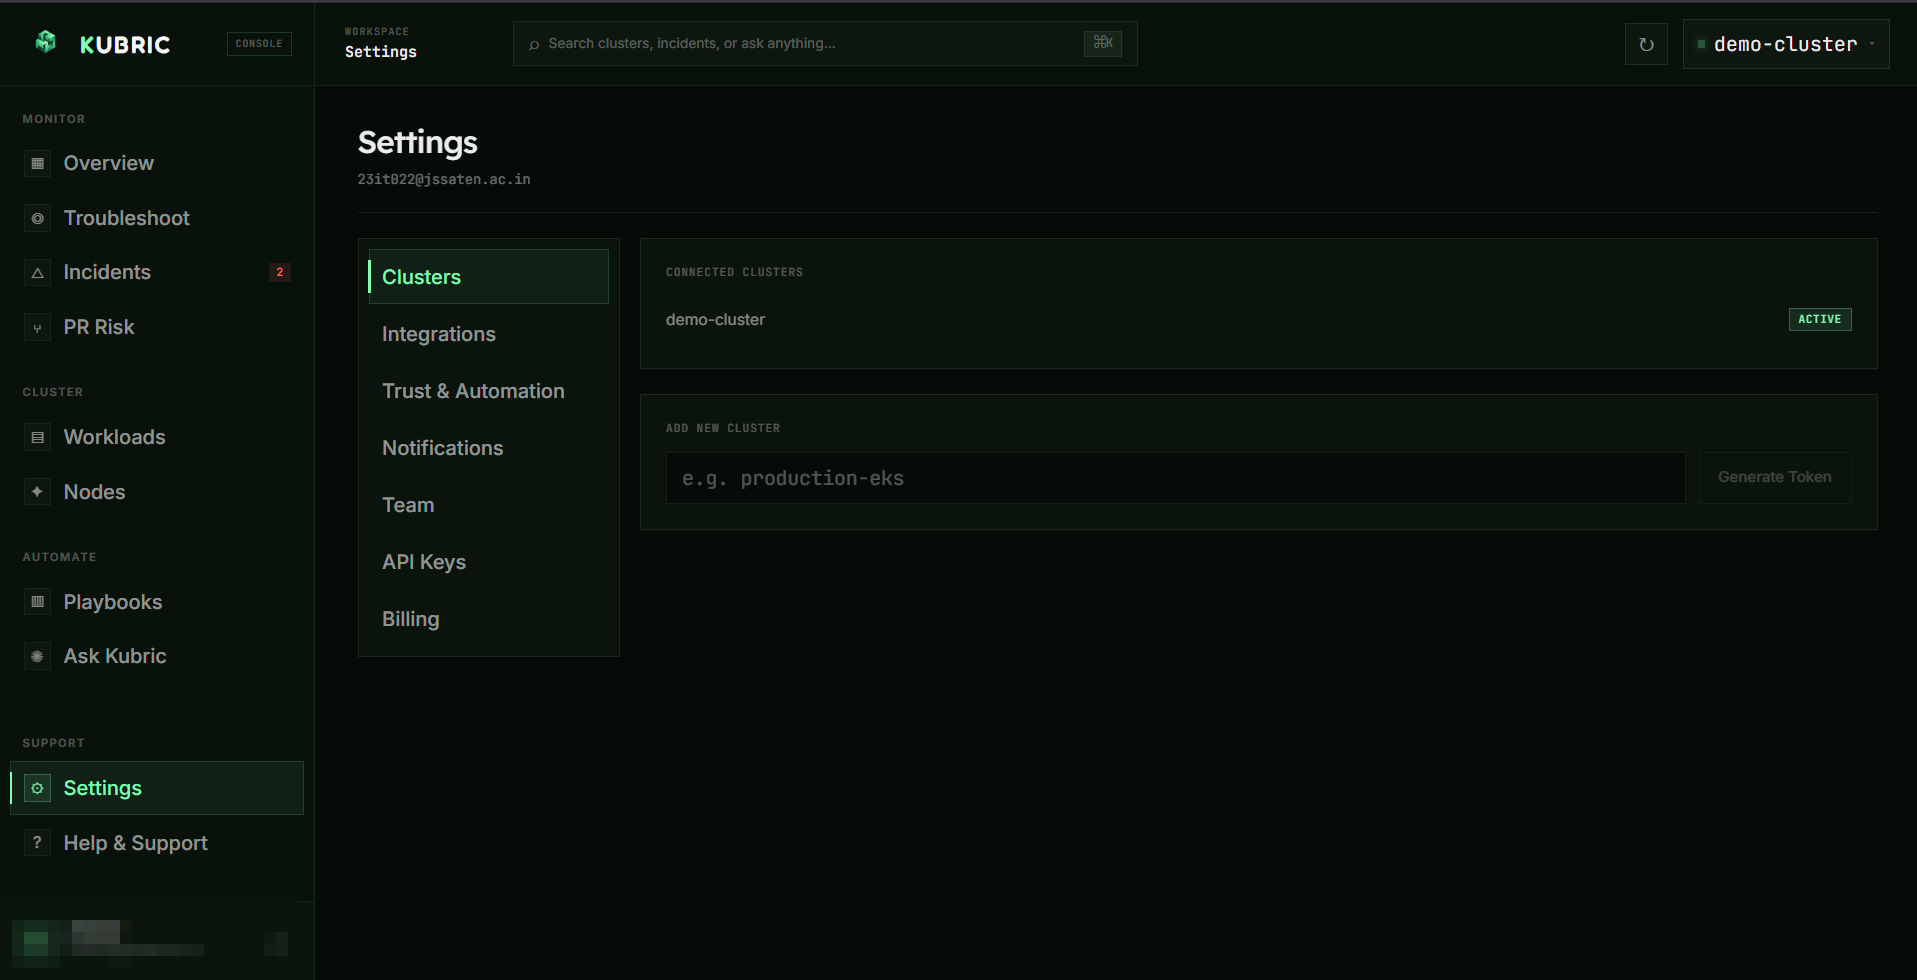
Adding another cluster
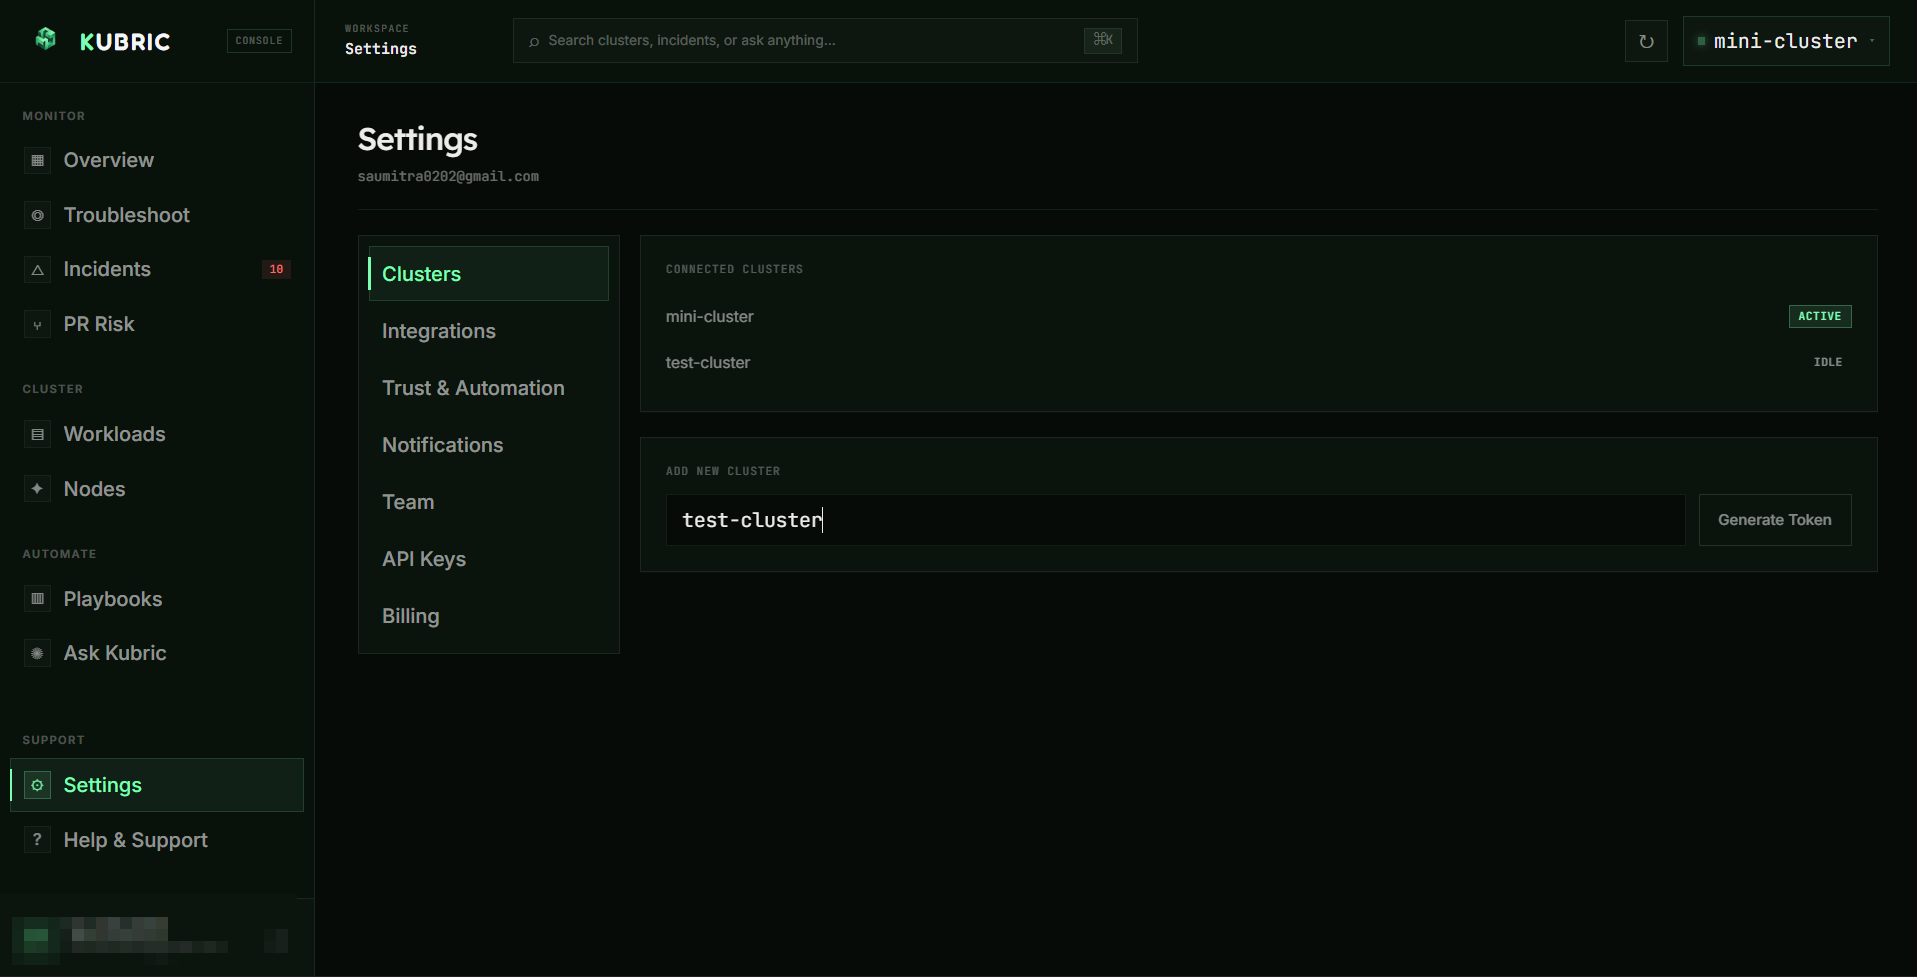
You're not limited to the cluster you connected during onboarding — you can add more at any time from Settings → Clusters. The flow is the same as the wizard: name the cluster, generate a token, then run the Helm command against it.
Open Settings → Clusters and start a new cluster
Enter a name for the cluster you want to connect (lowercase letters, numbers, and hyphens).
Generate the token and copy the command
Kubric issues a per-cluster token and builds the install command. Pick the tab matching your terminal (macOS/Linux, PowerShell, or Windows CMD), copy it, and run it against the target cluster.
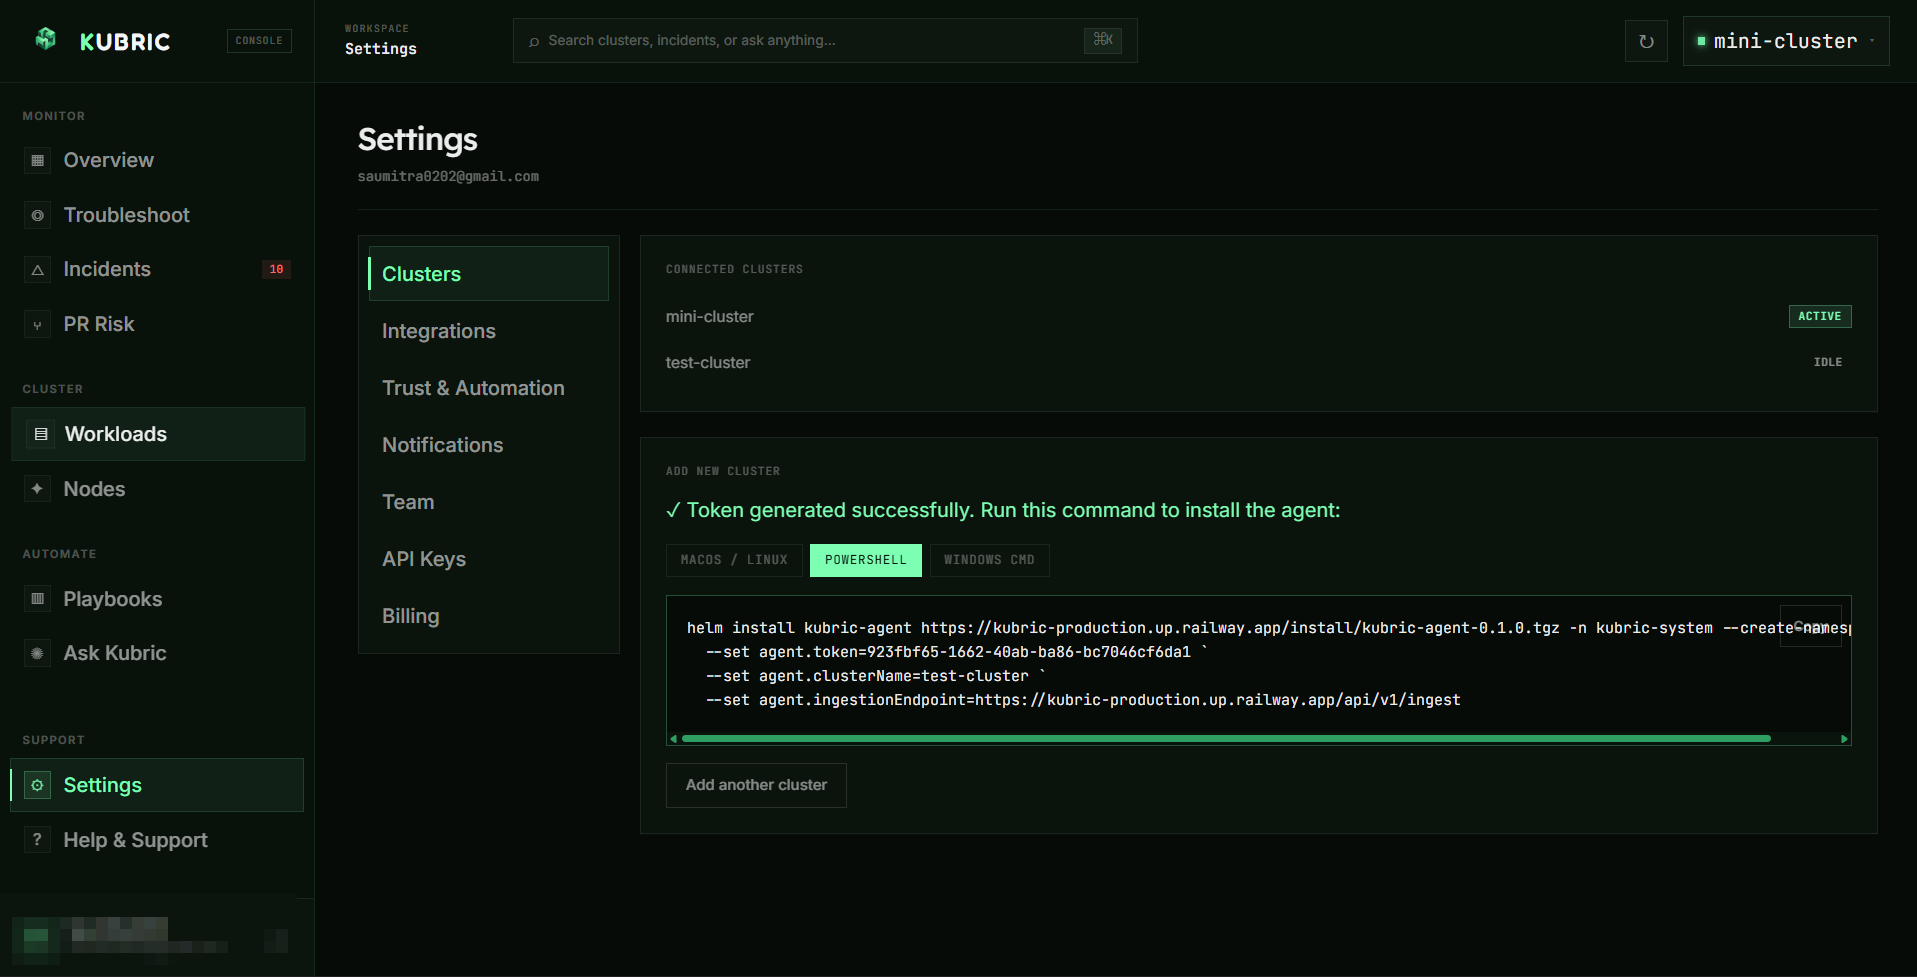
Each cluster gets its own token, so a leaked token only affects that one cluster. Reuse of a token across clusters isn't supported — generate a fresh one for each. Removing an agent later is a single helm uninstall →.
How it works
Kubric is a push architecture with a closed detect → diagnose → fix loop:
Your cluster                          Kubric cloud
  kubric-agent  ──state (15s)──▶  /api/v1/state   ─▶ dashboard
      │         ──incident──────▶  /api/v1/ingest  ─▶ AI diagnosis
      │◀────── approved fix ─────  /api/v1/actions  ◀─ you approve
└── executes fix (RBAC) ──▶ /actions/result ─▶ resolved- Detect: the agent watches every namespace and flags failing workloads.
- Diagnose: Kubric investigates the evidence (and, in agent reasoning mode, calls read-only tools to follow the cause across resources) and produces a root cause.
- Fix: on your approval, the in-cluster agent applies the remediation and reports back.
What Kubric can fix
Kubric can apply these remediations one-click:
| Fix | Resolves |
|---|---|
| Update resource limits | OOMKilled — raises memory/CPU limits (deterministic) |
| Update environment variable | CrashLoop from a missing/wrong required env var (deterministic) |
| Rollback deployment | A bad rollout, when a healthy previous revision exists |
| Restart pod | A wedged/stuck pod that a clean restart clears |
| Scale deployment | Over/under-provisioned replicas (e.g. unschedulable pods) |
Issues rooted in the container command or image content (e.g. an app that exits by design, or a missing image with no prior revision) are diagnosed with full evidence, but the fix requires a code/image change rather than an infrastructure action.
Security
- Outbound-only: the agent initiates all connections; Kubric never reaches into your cluster.
- Least-privilege RBAC: read access to cluster state, and only the specific verbs needed to apply an approved fix.
- Read-only by default, fix on approval: nothing changes without your click (unless you opt into Auto-fix with boundaries).
- Per-cluster tokens: a leaked token affects one cluster, not your whole fleet.
Troubleshooting & FAQ
The agent pod is stuck in ImagePullBackOff
The agent image must be pullable by your cluster. Make sure the image is in a public registry (or configure an image pull secret). On minikube you can also sideload it with minikube image load <image>.
CPU / memory show 0%
metrics-server isn’t serving data. Enable it (minikube addons enable metrics-server) and confirm kubectl top nodes returns numbers. Everything else works without it.
A deleted cluster still shows in the dashboard
The dashboard serves the last snapshot the agent pushed. Remove the agent and its stored state to clear it. Data goes stale when the agent stops reporting.
The agent pod is stuck in Pending on EKS
Almost always a scheduling issue, not a Kubric issue. If your nodes are named fargate-ip-…, it's a Fargate-only cluster and you need a Fargate profile for the kubric-system namespace — see EKS Fargate clusters. If they're EC2 nodes reporting "Too many pods", they've hit their pod-capacity cap — add a node. Always check kubectl -n kubric-system describe pod -l app=kubric-agent first.
“helm: path not found”
Use the exact command from the dashboard — it installs the chart from a URL, so you don’t need the project checked out locally.
How do I remove the agent from my cluster?
The agent is a standard Helm release, so uninstalling is one command. This works on any cluster (minikube, EKS, GKE, AKS):
# Remove the agent (deployment, service account, RBAC, secret)
helm uninstall kubric-agent -n kubric-system

# Optional: delete the namespace too, for a completely clean removal
kubectl delete namespace kubric-system
That's it — the agent stops pushing data immediately and nothing remains running in your cluster. On managed clusters, if you created a dedicated Fargate profile for kubric-system, you can delete that too (aws eks delete-fargate-profile).
The dashboard shows the last snapshot the agent pushed, so a removed cluster may linger until its data goes stale. Remove it from Settings → Clusters to clear it from your workspace.
Open the dashboard, connect a cluster, and run your first scan. Open the dashboard →